李柏堅老師 教學
1.開啟Image J→File→Open→TLC→DSC04278.JPG 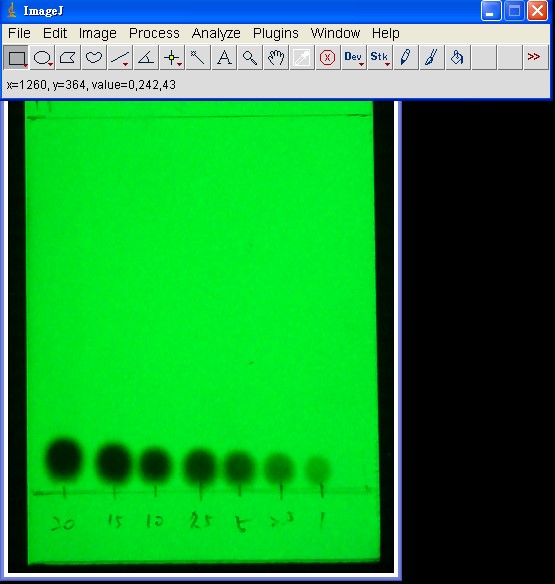
2.點選Image→Type→8-bit(我認為不轉換也沒有問題) 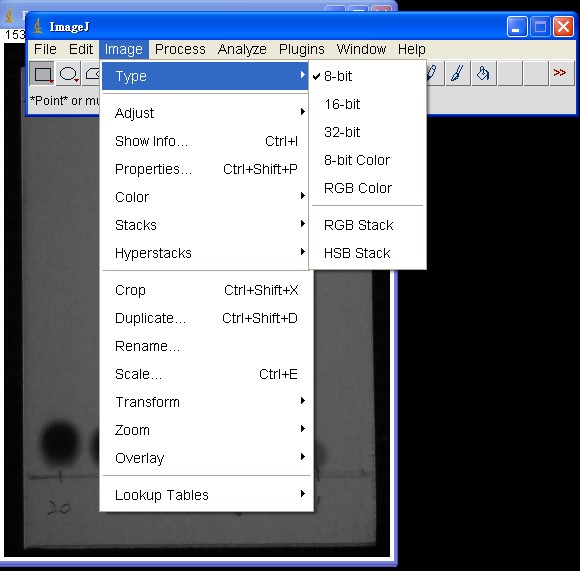
3.點選方塊工具拖曳跨越第1至第7個點 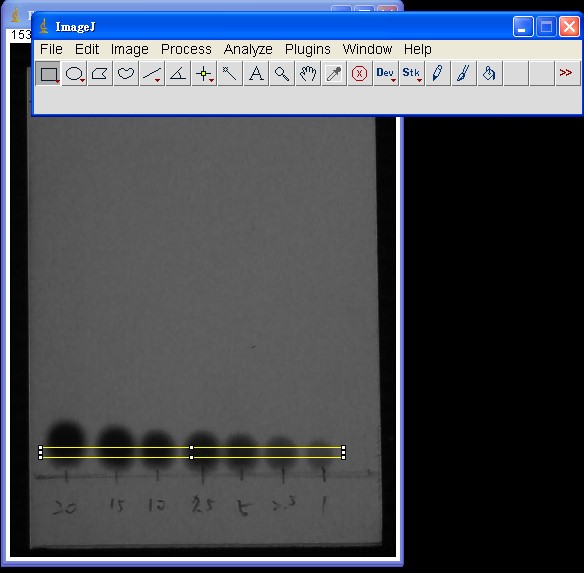
4.點選Analyze→Gels→Select First Lane 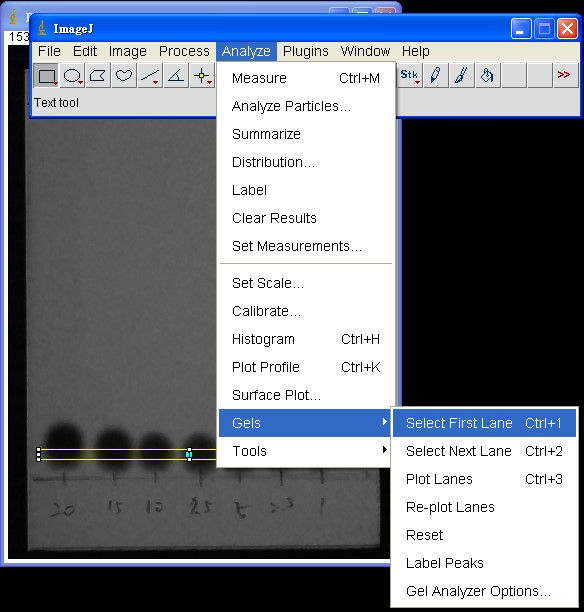
5.點選Analyze→Plot Profile 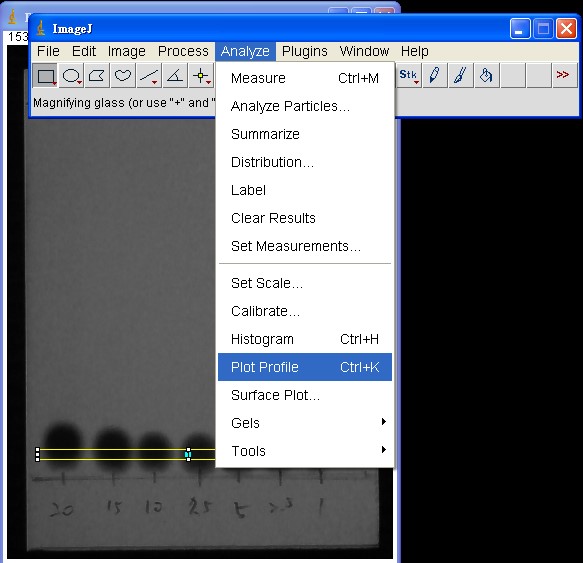
6.出現以 Gray Value 為y軸的圖,愈低表示愈黑(濃度高)→圖左下方點List 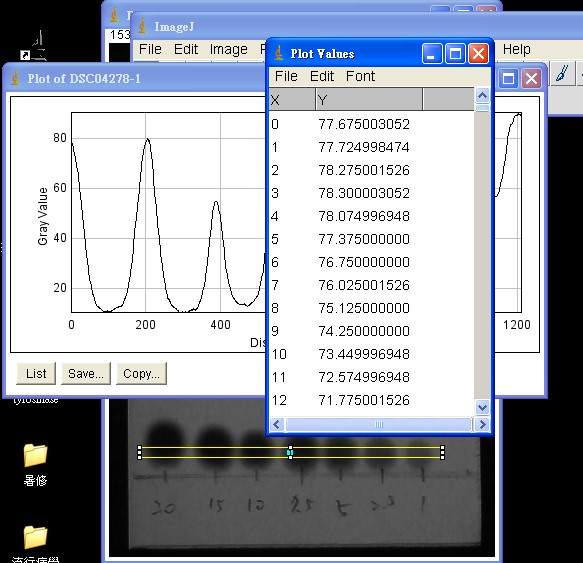
7.出現所有座標,File→Save As(xls檔) 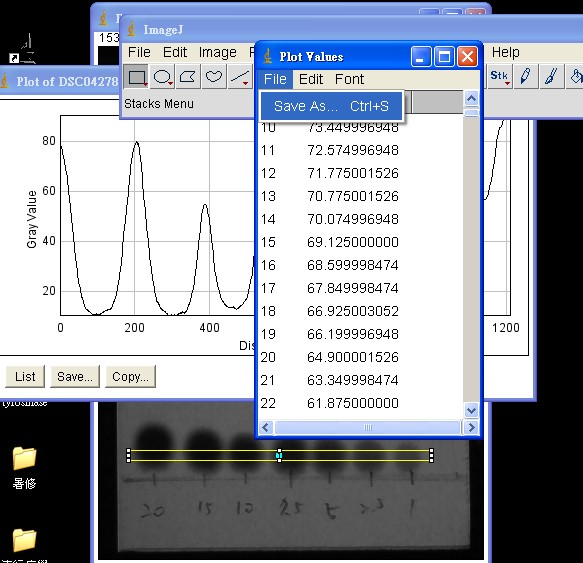
8.利用資料在EXCEL畫出圖並找出每個波的低點y座標 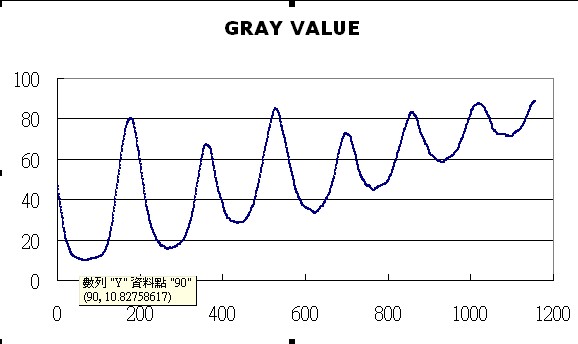
9.分析出來的結果還是有誤差(R-Square=0.9162) 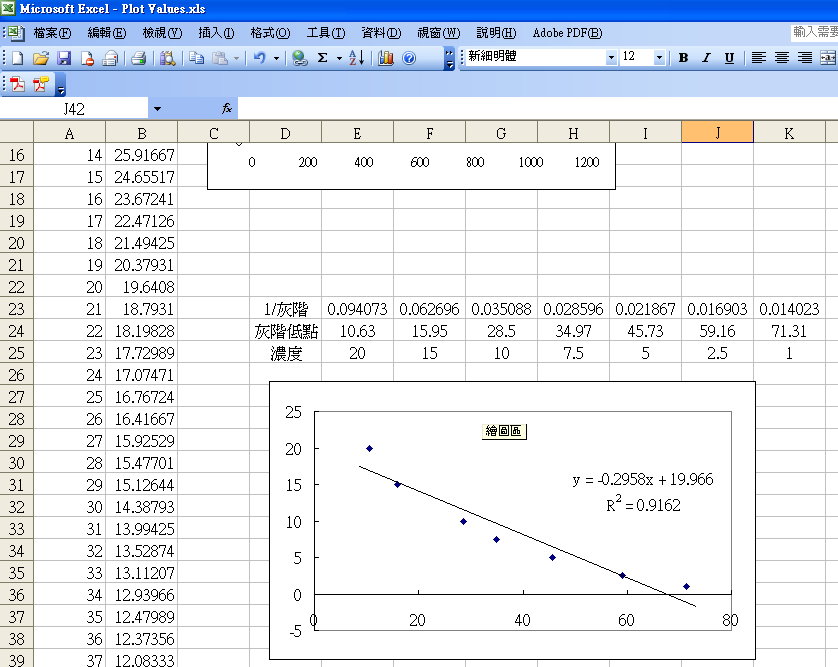
|