3.來畫函數的圖形折線圖
程式連結1 https://colab.research.google.com/drive/1tePLjFE0f7FslV_xYVJMrDcMHKWC0SN3?usp=sharing
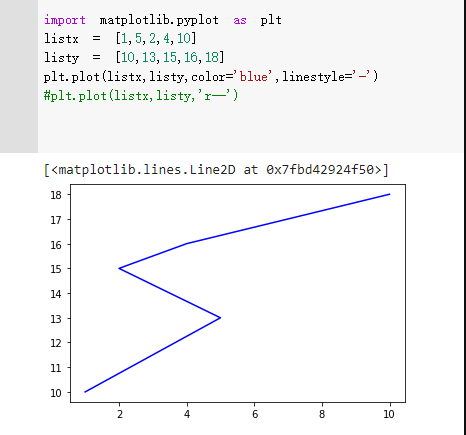
#範例2-3:繪出藍色虛線(x,y)圖 #1101ad010 陳惠妤 2022/9/18
import matplotlib.pyplot as plt listx = [1,5,2,4,10] listy = [10,13,15,16,18] plt.plot(listx,listy,color='blue',linestyle='-') #plt.plot(listx,listy,'r--')

程式連結2 https://colab.research.google.com/drive/1Ep3ldD8nyYiEBGBteJEz6xQ9pfCHS41J?usp=sharing
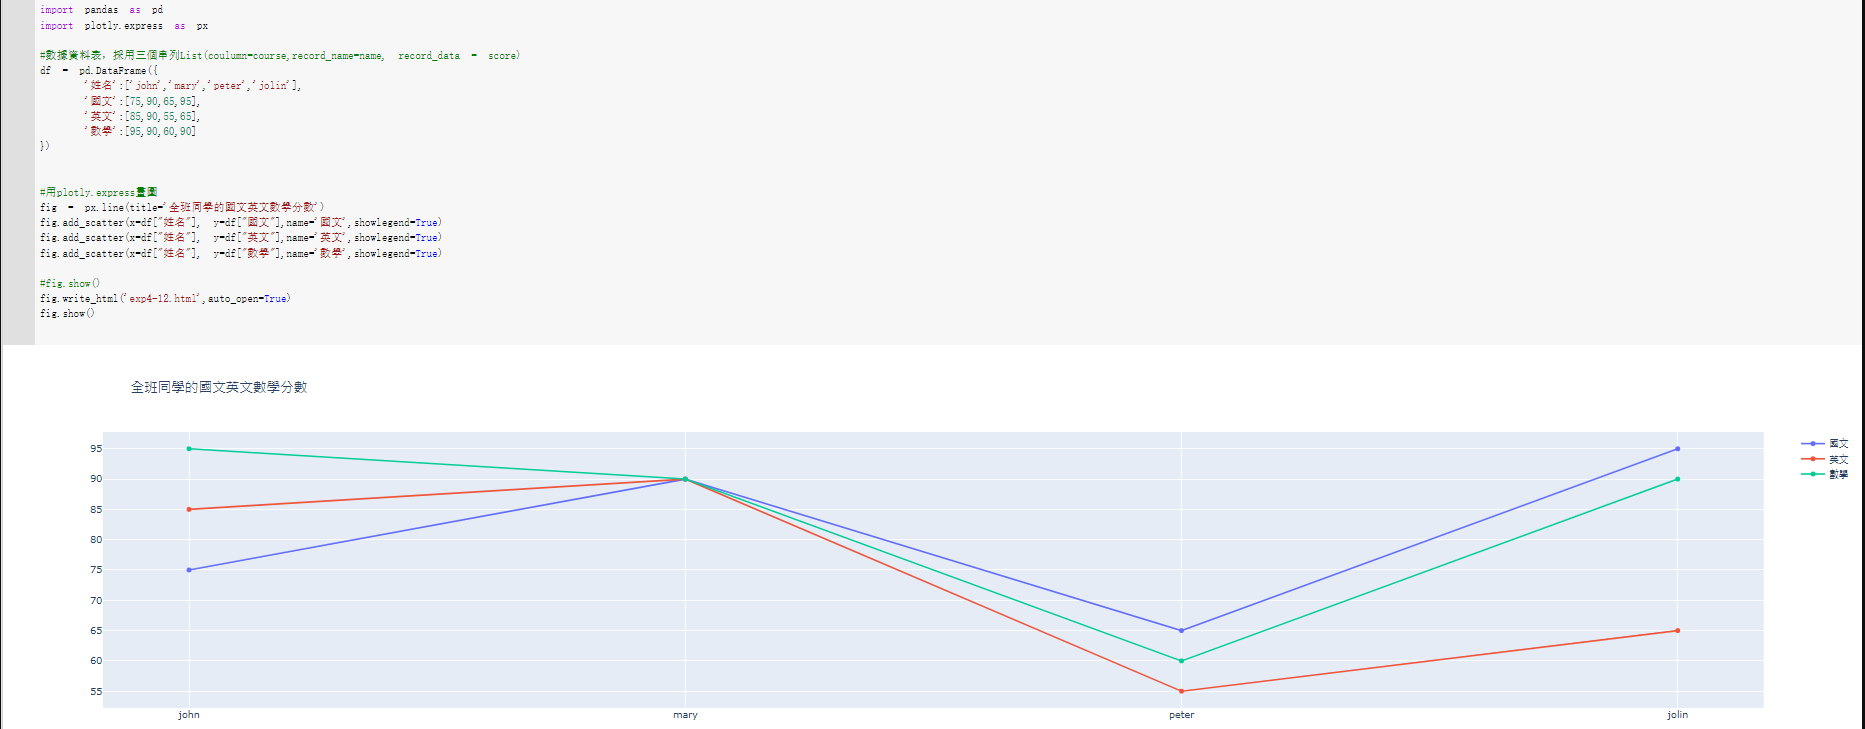
#範例4-12:自行建立DataFrame資料集,然後用express印出四位學生的三科成績 #1101ad010 陳惠妤 10/23 import pandas as pd import plotly.express as px
#數據資料表,採用三個串列List(coulumn=course,record_name=name, record_data = score) df = pd.DataFrame({ '姓名':['john','mary','peter','jolin'], '國文':[75,90,65,95], '英文':[85,90,55,65], '數學':[95,90,60,90] })
#用plotly.express畫圖 fig = px.line(title='全班同學的國文英文數學分數') fig.add_scatter(x=df["姓名"], y=df["國文"],name='國文',showlegend=True) fig.add_scatter(x=df["姓名"], y=df["英文"],name='英文',showlegend=True) fig.add_scatter(x=df["姓名"], y=df["數學"],name='數學',showlegend=True)
#fig.show() fig.write_html('exp4-12.html',auto_open=True) fig.show() 
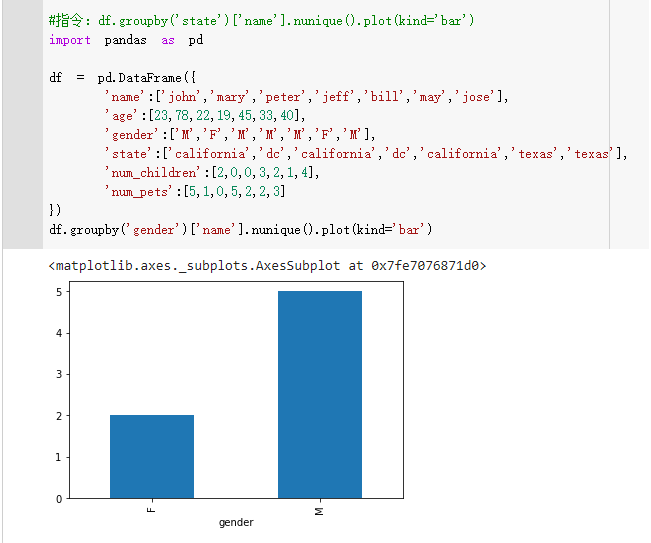
程式連結3:https://colab.research.google.com/drive/1MkIq90CyuP6DYPGGiOdPVtweccbURv1i?usp=sharing #範例3-7:統計同一州的人數柱狀圖顯示(state vs name)Bar plot with group by #1101ad010 陳惠妤 2022/9/18
#指令:df.groupby('state')['name'].nunique().plot(kind='bar') import pandas as pd
df = pd.DataFrame({ 'name':['john','mary','peter','jeff','bill','may','jose'], 'age':[23,78,22,19,45,33,40], 'gender':['M','F','M','M','M','F','M'], 'state':['california','dc','california','dc','california','texas','texas'], 'num_children':[2,0,0,3,2,1,4], 'num_pets':[5,1,0,5,2,2,3] }) df.groupby('gender')['name'].nunique().plot(kind='bar')

|
|


